A restaurant's pricing model is one of its most consequential decisions — and one of the least frequently reviewed. Most independent restaurants set their prices at launch, adjust occasionally for inflation, and leave the structure largely unchanged.
But menu engineering — the discipline of designing menus to maximise profitability while maintaining guest satisfaction — is one of the highest-ROI activities a restaurant owner can undertake. A well-engineered menu can increase gross margin by 3–5 percentage points without changing a single ingredient.
Here's how to approach it properly.
What Menu Engineering Actually Is
Menu engineering is not just raising prices. It's the systematic analysis of which items on your menu contribute most to profitability, and then designing the menu to make those items more visible and appealing.
The framework that most hospitality operators use was developed by academics in the 1980s and remains the foundation today. Every menu item is classified into one of four categories based on two variables: popularity (how often it's ordered) and profitability (its contribution margin — selling price minus food cost).
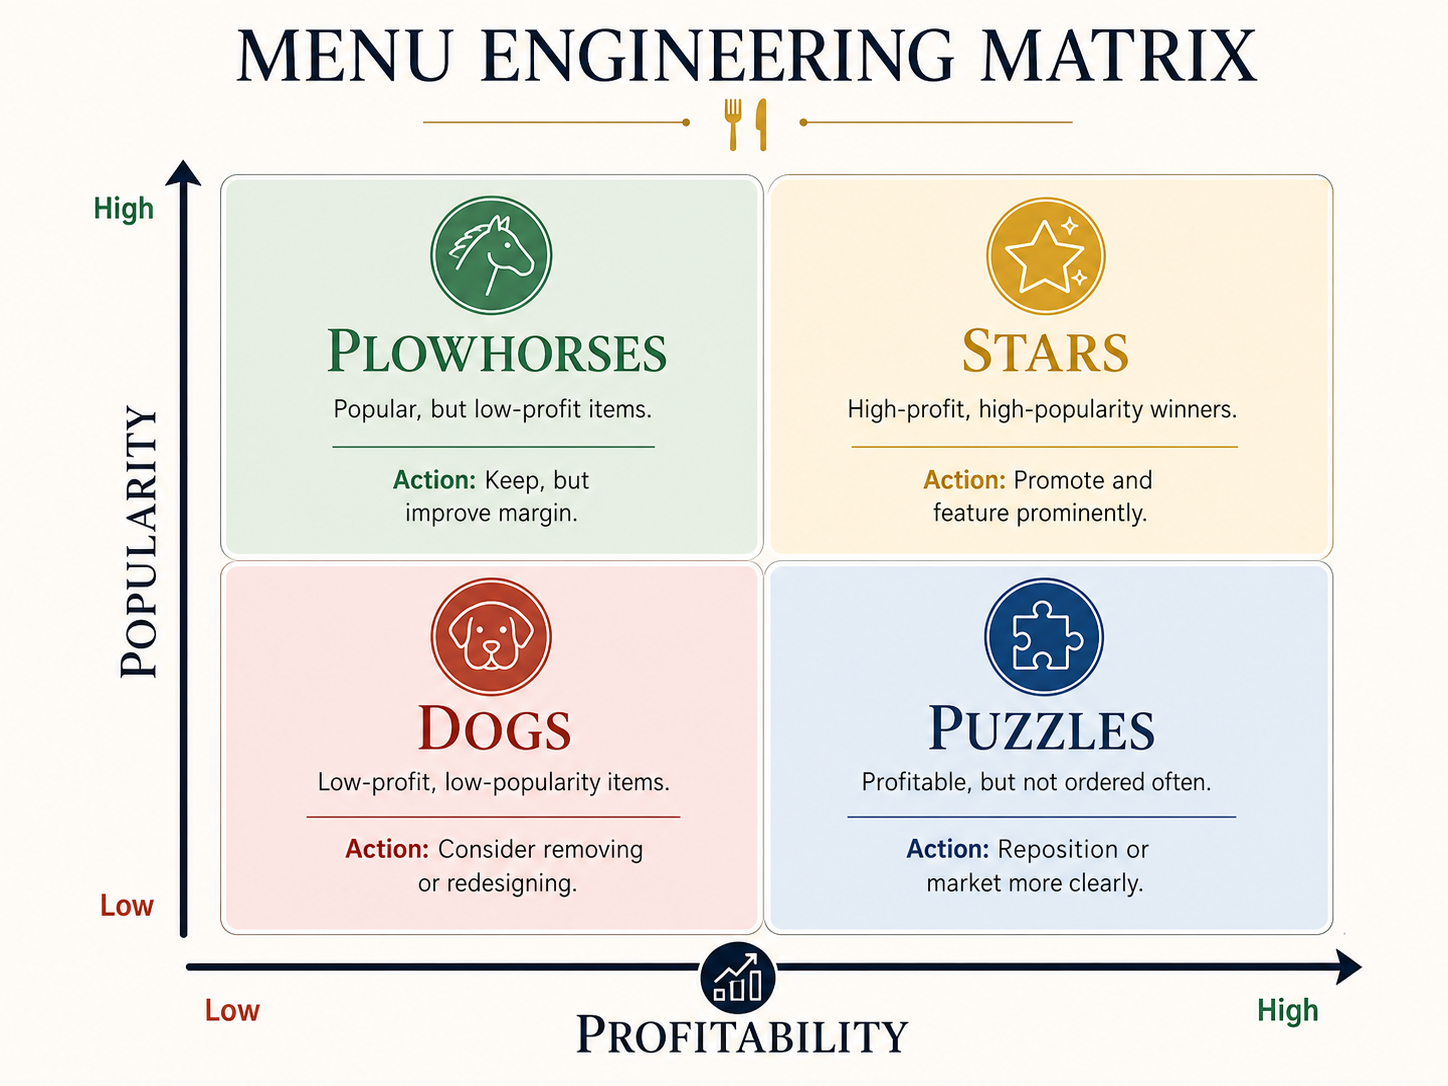
[INFOGRAPHIC: The Menu Engineering Matrix]
A 2x2 matrix with four quadrants:
- Top right: STARS — High popularity, high profitability. Keep these, promote them.
- Top left: PLOWHORSES — High popularity, low profitability. Explore cost reduction or modest price increase.
- Bottom right: PUZZLES — Low popularity, high profitability. Improve positioning, rename, or promote.
- Bottom left: DOGS — Low popularity, low profitability. Remove or reimagine.
X-axis: Profitability (low → high). Y-axis: Popularity (low → high).
Tablemap brand colours. Clean quadrant labels in bold.
Step 1: Know Your Contribution Margins
Before you can classify items, you need accurate food cost data for each dish. This requires:
- A recipe costing sheet for every menu item
- Current ingredient costs (updated at least quarterly in 2026)
- A clear understanding of portion sizes
Contribution margin = Selling price – Food cost. That's your profit per dish before labour and overheads.
Most independent restaurants have a rough sense of this. Menu engineering requires precision.
Step 2: Track Item Popularity
Your POS data is the source here. Over a rolling 3-month period, track how many times each menu item is ordered. Calculate each item's share of total covers sold.
An item is considered "high popularity" if it's ordered above the average frequency. If you have 20 main course options and the average item is ordered 12 times per week, any item ordered 12+ times is in the upper two quadrants.
Step 3: Classify and Act
Stars (high popularity, high margin): Your most valuable items. Maintain quality obsessively. Mention them in pre-visit messages. Train staff to describe them enthusiastically. Consider including them in premium meal packages.
Plowhorses (high popularity, low margin): These are selling well but not making you money. Options:
- Reduce portion size slightly (if appropriate)
- Find a cheaper alternative ingredient without compromising quality
- Increase the price modestly (guests who order this regularly may accept a £1–2 increase without switching)
Puzzles (low popularity, high margin): These should be your stars. Investigate why they're not selling: is the name uninspiring? Is it positioned poorly on the menu? Would a staff recommendation increase uptake?
Dogs (low popularity, low margin): These items are occupying menu space and kitchen prep time without contributing. The question is honest: are they worth keeping?
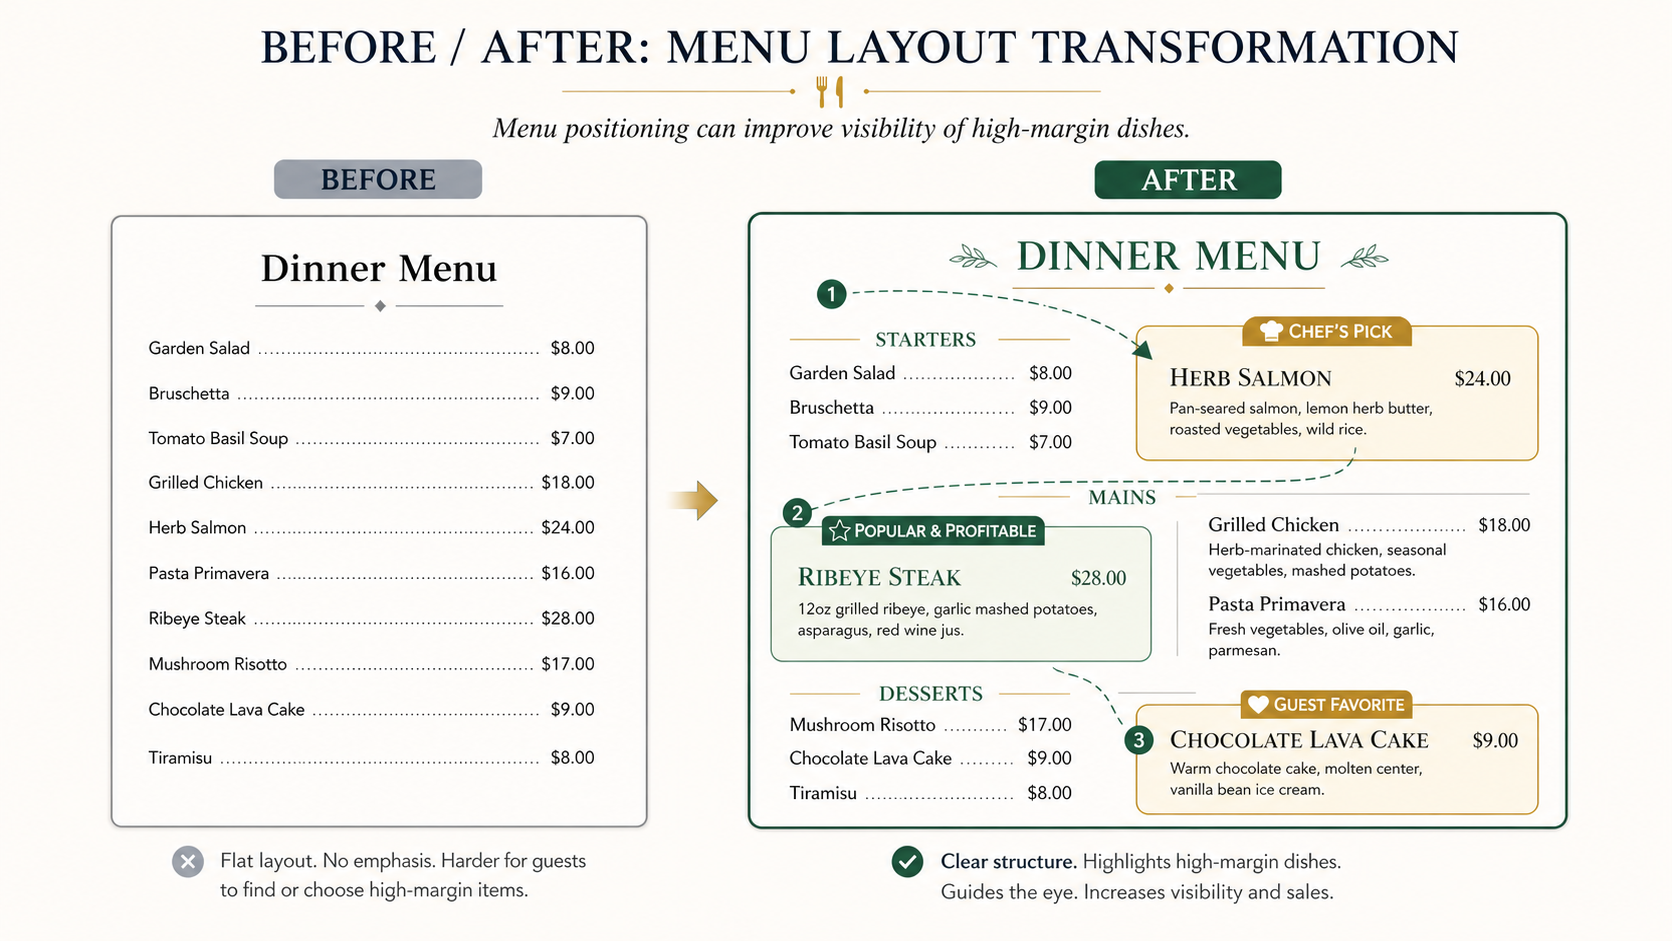
[IMAGE: A Before/After Menu Layout Comparison]
A simple side-by-side mockup of a menu section:
- Before: 8 items listed uniformly, no hierarchy, no visual cues
- After: Stars highlighted in a box or with a small visual indicator, the most profitable items in the "eye path" position (top-right of a list, second from the top in a column)
Should be readable and realistic. Can be a clean illustration, not a real menu scan.
Menu Layout: The Visual Layer
Once you know which items are Stars, you need guests to see them.
Research on menu reading patterns shows that diners typically look at a menu in a specific sequence: the centre first, then the top right, then the top left. The bottom of any list is least likely to be read carefully.
Practical applications:
- Place Stars in the natural reading path (first or second position in a category)
- Use subtle visual cues — a box, a slightly larger font, a small illustration — to draw the eye to high-margin items
- Avoid leading with prices. Listing the price immediately after the dish name draws attention to cost. Placing it at the end of the description shifts attention to the food first.
Pricing Considerations in 2026
Ingredient costs in 2026 remain elevated. A menu pricing review is justified not just as a menu engineering exercise but as an inflation-response exercise.
The data suggests UK diners have broadly accepted modest price increases when the experience quality is maintained. The sweet spot for an acceptable increase — where guests don't react negatively or choose lower-cost items instead — is typically 4–8% on individual dishes.
A 6% increase across your Stars may be less visible to guests than a 15% increase on a single item. Distribution matters.
How Tablemap Supports Revenue
Tablemap gives you the guest data that informs which table configurations and booking times are most profitable. Combine that with menu engineering data and you have a complete picture of where your margin is being made and where it's being left on the table.